Wednesday, August 18, 2010

Gold changing correlation with Dollar

Gold is a usually popular hedge against currency weakness. A weak U.S. currency also makes dollar-priced gold cheaper for holders of other currencies and vice versa. This link sometimes breaks down in times of widespread financial market stress, however, as both Gold and the Dollar Index benefited from risk aversion. Their correlation was 90% negative in late 2008 and early 2009 after the Lehman Brothers crisis and Recession.

Four months ago, when Europe’s debt crisis made markets panicking about sovereign risk, it seemed that all roads led to the dollar. The greenback started rising against the other big global currencies, the yen, pound and euro. Its role as the world’s reserve currency seemed an inestimable advantage when investors were unsure where they could safely park their cash. Within the rich world, America’s economy looked the best of a bad bunch. The stage seemed set for a dollar rally. Gold was also considered as safe heaven and it rose in tandem with Dollar Index with correlation reaching close to + 90% during June 2010.


On June 10th, COMEX Gold and Dollar Index made an interim top and started falling as the safe heaven appeal lost its status as Quantitative Easing measures were announced by European Central Bank. ECB broadened its efforts to ease market tensions and minimize damage from the debt crisis by offering short-term loans to banks on top of existing efforts to boost government debt and keep interest rates at record lows. The ECB said it would keep the key rate at a record low of 1 percent, while its chief, Jean-Claude Trichet, said the bank would offer unlimited amounts of 3-month loans to banks to increase liquidity in the financial sector.

How quickly things have changed! On August 11th, the dollar fell to a 15-year low against the yen of ¥84.7. It perked up against the euro to $1.32, though that was still much weaker than the $1.19 it reached in early June when euro-revulsion was at its worst. On August 10th, the Federal Reserve conceded that the recovery would probably be slower than it had hoped. The Fed kept its main interest rate in a target range of 0-0.25% and stuck to its creed that rates would need to stay low for “an extended period”. In addition the central bank said that it would reinvest the proceeds from the maturing mortgage bonds it owns into government bonds to prevent its balance-sheet (and thus the stock of ready cash) from gradually shrinking.

Gold has currently 80% positive correlation with Dollar Index now and this again is expected to reverse as Dollar will lose its shine as US heads for Double Dip Recession. Gold is expected to trade inversely of Dollar Index going ahead. The leading indicators suggest that the probability of a US double-dip recession in the next 6-9 months is around 50-50%. The Economic data are pointing too gloomy picture of US ahead. U.S. trade deficit has widened in June, Job creation is stagnant, Initial weekly claims for unemployment are at the highest level since February, Construction and Home sales are sluggish, and Consumer spending remains weak. Every slim piece of economic data will be put under the microscope by financial markets now onwards in the wake of the Federal Reserve's new caution about the outlook. The data will be sliced and diced and spun in a centrifuge for signs of whether the economy is sinking into an actual double-dip downturn or whether it only has hit a soft patch. Therefore COMEX Gold is expected to cross its record high of $1260 soon and trade above $1300 in next 1-2 months.

Monday, August 2, 2010

US GDP data shows Gross Distorted Position of the Country

The publication of the US 2nd quarter GDP figures highlighted several striking and interlinked structural trends in the US economy. These go considerably beyond the well publicized slowing of the US economic recovery. The data confirms the US recovery is weak. Unsurprisingly, because it was anticipated, and as has been widely reported, the data confirmed the slowdown in US economic recovery.

The advance estimate of second-quarter GDP growth came in at 2.4%, below the expectation going into the report of 2.7%, underlining a deceleration in growth. That deceleration was made starker still because first-quarter growth was revised up to 3.7%, from the previous 2.7% estimate. The report included revisions going back to 2007, and despite the upward revision to the first quarter, revisions overall reduced historical growth estimates.

Consumer spending – which accounts for two-thirds of US GDP and is seen as a lead indicator of economic recovery – slowed, rising by 1.6pc in the quarter, compared with 1.9pc in the prior three months. The savings rate rose to 6.2pc as consumers instead put money to one side. The biggest factor in the slowdown was the US's widening trade deficit, following a 28.8pc surge in imports – the sharpest rise in 26 years – against a 10.3pc rise in exports.

Historical revisions in GDP report, stretch back to 2007, and they have reduced growth by an average of 0.2 percentage point per year. The biggest shift is in 2008 growth (now zero instead of 0.4%). The peak-to-trough decline in GDP during the recession is now 4.1%, instead of 3.8%, further underlining the status of this recession as the worst in the postwar era. For those interested in the minutiae, the peak GDP quarter is now the fourth quarter of 2007 with GDP of -6.8%; the rise in GDP during the second quarter of 2008 is now insufficient to reverse its first-quarter drop. As a result, the peak GDP quarter now lines up with the official monthly cycle peak of December 2007, identified by the NBER's Business Cycle Dating Committee.
Such figures have essentially decided the debate between those who argued that because the US downturn was very severe its economy would spring back strongly from recession, and those, such as the present author, who pointed to the underlying structural situation of the US economy and therefore argued recovery would be weak compared to previous US post-war business cycles.

Chart below illustrates how much weaker the present US economic recovery is than in previous post-war business cycles. In the previous most serious post-war cyclical downturn, that following 1973, the US economy regained its previous peak level of production after eight quarters. In this recession after 10 quarters the US economy has still not recovered its peak GDP level.

Source: US Bureau of Economic Analysis

As also widely reported, the new GDP data now calculates the US recession was deeper, and started earlier, than previously estimated. Peak US GDP is now analysed as having occurred in the 4th quarter of 2007 rather than the 2nd quarter of 2008 as previously estimated. The trough of US GDP in the 2nd quarter of 2009 is now calculated to have been 4.1% below the cyclical peak level - the previous deepest fall in a US post-World War recession, that after 1973, was 3.2%.

These revisions help explain a few head scratchers that have irritated economists in recent months, but still don’t fully resolve them. First, the deeper recession will temper some of the unusually strong productivity gains that were reported over the recession. Second, that deeper recession also provides a little more rationale for the large degree of job losses that materialized over the period. Third, the resulting larger amount of economic slack provides a little more support for the persistently low rate of core inflation (with pressures still on the downside), as the recovery gets increasingly long in the tooth.

Some economists - Geithner, Summers etc - say that the US is recovering. Some others, such Marc Faber, say that the US is not recovering and it is headed into inflation. Still others agree that the US is not recovering, but they also believe it is headed into hard-core deflation. But Bill Bonner of Daily Reckoning, calls all of them wrong and instead believes the US is headed into soft-core, Japanese-style deflation. It remains to be seen who eventually turns out to be correct. Given the importance of the US economy, investors in India will also feel the impact.

Thursday, June 17, 2010

Enigma in Natural Gas Market – Is history set to repeat, or Is this time different?


A sharp move in natural-gas-market contracts has caught traders' attention and sparked talk that at least one market participant may have been caught on the wrong side of a trade.

The March-April 2011 spread, a benchmark relationship because it covers the period from winter to spring, has surged as much as 134% this month and 204% since early May (i.e., since Gulf Oil Spill). And we have also seen the spread in the Oct-Nov halved from 45 cents to 19 cents since early May.

NYMEX Natural Gas Prices and Spread

Source: Bloomberg

In a highly unusual move for this time of year, the price of natural gas for delivery March 2011 on Tuesday jumped to 43.3 cents more than the price for delivery in April. The gap, which was just 24.8 cents on last Friday, narrowed slightly to 36.8 cents on Wednesday. Trading volumes in both contracts have spiked.

Gas prices are typically higher in March, the last month of winter, than in April, when spring temperatures limit the demand for natural gas for heating. A trader expecting an unusually cold winter, for example, would bet on a wide spread between March and April gas prices.

The trade is the same bet that brought down Amaranth Advisors LLC, a Greenwich, Conn., hedge fund, in September 2006. Brian Hunter, a Canadian trader at the firm, placed an enormous bet on the spread on the belief that the March contract would be traded at a huge premium over April. But the spread narrowed from $2.5 to 42 cents that fall, costing the firm $6 billion.

This is peculiar behavior, given that supplies are currently building at a comfortable pace, i.e., whatever the knock-on to gas demand from the situation in the Gulf, it will likely not affect this season’ s refills nor next winter’s deliveries. Moreover, Natural gas U.S. inventories has risen to their highest level for this time of year in June since at least 1993, when the government began collecting data

10 Year Seasonal Natural Gas DOE Inventory Storage Data.

Source: Bloomberg

This then begs the question: are other factors impacting the price path of these spreads? After all, once these spreads lock into a trend they stay on trend, regardless of the underlying fundamental picture. Until last week, the March-April 2011 price spread was very thinly traded because long-term weather forecasts are unreliable, and traders typically don't start making bets on winter gas prices until later in the year. However, both of these spreads of currently decoupled from their respective trends. We haven’t seen these particular spreads behave in such a manner since an Amaranth morphed a $9 billion hedge fund into a $3 billion fund in August 2006. In September 2006, when Amaranth had to reverse its trades, the March-April spread tumbled to as low as 42 cents per million Btu from as high as $2.5 in August. At the time, the spread measured the difference between March 2007 and April 2007 prices

The move in the March-April spread probably wasn't caused by a change in weather forecasts or supply predictions, but there can be two reasons:

CASE I: A trader trying to exit a sizable bet on the spread after a bad wager on something else forced the trader to meet margin calls.

CASE II: Major traders may also be anticipating the U.S. moratorium on offshore drilling in the Gulf of Mexico following the Deepwater Horizon rig explosion will cut gas supplies and alternatively, it may be the result of a single speculator taking a larger-than-normal position contrary to the consensus.


Thursday, June 3, 2010

MONTHLY VIEW ON COMMODITIES - JUN 2010

Commodities in May had their steepest monthly decline in 18 months, with a key sector index Reuters-Jefferies CRB index finished down 8.3 percent for May -- its biggest monthly decline since Lehman Collapse. Macroeconomic affairs continued to dominate price direction in commodities, while fundamentals played second fiddle. The whole last month passed away in solving Greece’s issue as major economic actions took place by European countries and IMF. Germany's parliament approved a $1 trillion safety net to stabilize the euro as fears swirled that Europe's debt crisis and tougher financial regulation may choke economic recovery.

Euro was poised for a sixth monthly loss against the dollar amid concerns Europe’s efforts to reduce fiscal deficits and stem a sovereign-debt crisis will undermine the region’s recovery. The common currency dropped 7.6 percent in May, the longest monthly losing streak since April 2000. Germany has temporarily banned naked short selling of some securities in the European Union to prevent euro’s gain. Euro is expected to trade in range of 1.15 to 1.25 in the month of June

Crude oil futures posted their worst monthly performance since December 2008 declining more than 15% ended at $74 for May 2010. . Oil prices fell to $65 from $86 in the first half as Euro plunged to near 1.21 against dollar curbing investment from oil to precious metals and dollar. Crude oil futures recovered from lows and managed to trade near $75 in the second half as subsequent moves by EU finance ministers to guarantee liquidity for vulnerable economies restored confidence in the world markets.
The most awaiting hurricane season is at the gate and NOAA- National Weather Service projects ‘active to extremely active’ Atlantic Hurricane Season for 2010. There is a 70% chance that three to seven major hurricanes will swirl in the Atlantic in the six months following the start of the hurricane season on June 1, according to NOAA's Climate Prediction Center. A typical season has 11 named storms, six hurricanes and two major hurricanes. Oil prices are expected to trade higher and may see $87 levels facing very volatile sessions on better economic outlook supported by summer driving demand and speculative trades on Hurricane season with support at $65.

Natural Gas futures rallied more than 10% capping the biggest monthly gain after December 2009 ended at $4.34. Natural gas prices managed upward momentum from the previous month as investors hatched the buying opportunity at $4 on higher demand forecast in summer. Natural gas prices are expected to trade higher on summer cooling demand expectation and supplies and shipment disruption problems in GoM due to BP oil spill backed by intense hurricane season forecast. Growing supplies will limit upside with resistance at $4.70 level, support for falling prices lies at $3.80

Gold-“A mask of Gold hides all deformities.” –The statement proved to be correct in the last month as investor around the world rushed for safe heaven demand against probable expectation that Europe’s debt Crisis may stall the global recovery resulting the bullion to make all time high of US $1250 an ounce. ETF’s around the world bet the most on Gold as many of them made the all time high holdings. SPDR, the biggest Exchange traded Fund backed by bullion has added the skyrocketing 109 Metric Tons on a monthly basis making the all time high of holdings at 1268 Metric Tons. Indian Gold Prices also rallied to record high Rs 18700/ 10 gm, rising 7% during the month of May. This rally was supported by 4% depreciation in India Rupee and 3% price rise in COMEX Gold. The expected Price Range for Gold June Month contract is $1170/oz to $1280/oz.

Silver, basically a precious metal but because of it’s large industrial usage often considered as an industrial metal and hence sometimes guided by the metal prices which is what exactly has happened in the last month. Even after strong China’s CPI as well as positive US industrial data Euro pessimism overshadowed the Silver demand in the expectation of slower global recovery resulting the flat ending with the 0.37% in red trading at $18.56/oz. For the June month, we expect the prices to trade in the range of $17/oz to $21/oz.

Base Metals complex nose-dived in the previous month as the debt concerns overhaul in the market coupled with dollar’s rally and mounting speculation that China’s efforts to cool its economy will erode demand from the largest consuming nation. Base metals prices were dominated by mixed sentiments in the market as positive economic data from US and ongoing European crisis meddled with prices. US economic data showed improvements in housing and consumer confidence but only managed to spark brief strength in the counters. For next month, prices of base metals to remain more or less sideways with negative bias during June. Lead and zinc looks negative on lack of real demand, while copper and nickel could see some buying opportunity at lower levels.

Copper closed at Rs 319 per kg, down near 3% in a month. The decline in LME Copper forwards was more than what we saw in Indian futures. LME three-month forward prices settled at $ 6940 per tonne, down by 7%. Inventories were down in May, declining by 22575 tonnes or 4.5% in LME to 476725 tonnes. One Month expected trading range for LME Copper would be $6000/t-$7400/t.

Lead and Zinc futures declined sharply, as risk-averse investors abandoned the volatile base metals market and headed for safe haven investments such as gold. Lead market fundamentals remain weak, at least over the near term. Stockpiles are rising and there is no sign of decreasing output, or increasing demand. Lead for three month delivery on the LME hit $1721 level and closed at $1850, down 17%. Next Month expected trading range for LME Zinc would be $1700/t-$2200/t and Next Month expected trading range for LME Lead would be $1550/t-$1950/t.

Nickel prices have remained relatively strong during the year however last month was skeptical due to jitters in broader markets. Lower Steel prices and declining confidence of investors have affected the prices of Nickel badly. LME 3-month nickel prices came under pressure on Europe sovereign debt default contagion fears and threats of Chinese monetary tightening. LME nickel prices settled at $21350/t, worst performer on metals counter as down by nearly 19%. Next Month expected trading range for LME Nickel would be $19500/t-$22000/t.

Thursday, May 13, 2010

A GREEK TRAGEDY IN THE EUROZONE


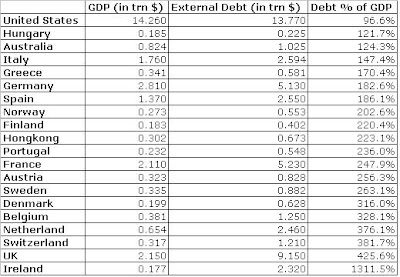
Investors have been disheartened by the events taking place in Greece over the past few weeks, which have been a setback to the global financial recovery. It’s interesting to take a look at Greece’s External debt-to-GDP ratio and compare that to other countries to see how dire the situation really is. You might be surprised to know Greece’s debt-to-GDP ratio isn’t actually the highest in the Eurozone.

External debt (or foreign debt) is that part of the total debt in a country that is owed to creditors outside the country. The debtors can be the government, corporations or private households. The debt includes money owed to private commercial banks, other governments, or international financial institutions such as the IMF and World Bank. This is similar to how an individual’s debt can include business loans, mortgages, credit card debt or student loans. Debt-to-GDP measures financial leverage of an economy.

World Top Twenty Debtors Nations

Source: External Debt (2009) information from The World Bank, GDP (2009) information from the CIA World Factbook.

When the European Union (EU) was formed, there was a fiscal deficit limit of 3 percent of GDP, but very few countries have honored that. Greece has a fiscal deficit of 12 percent of its GDP, four times the limit specified in the eurozone agreement. When the Eurozone was formed, its criteria also called for a government’s debt-to-GDP ratio to be below 60 percent—which also hasn’t been honored either.

So what does this mean? According to the World Bank and the IMF, external debt sustainability (the ability of a country to repay foreign debts) should not be more than 250 percent of a country's revenue or 150 percent of exports. Higher external debt is harmful to the economy and most likely will result in default.

So what are the causes of the high debt-to-income ratios in Europe?
Expensive labor.
Expensive exports.
Expensive currency.
Small population.
High levels of taxation and large social welfare systems.

Deficit spending, government debt and private sector borrowing are the norm in most western countries, but due in part to the financial crisis, some nations and economies are in considerably worse debt positions than others.

Most popular rhetoric on the topic would claim that wealthy countries have grown accustomed to being wealthy and they are enthralled by consumerism – it could be argued that this high level of debt could be a result of a culture that is used to and willing to buy now, and pay later…even if it means with interest.


Friday, April 23, 2010

Impact of Yuan Revaluation on Commodities

Beijing faces international pressure to scrap the yuan's peg, especially from Washington, which says the currency is seriously undervalued, sparking reports China may be about to revalue the yuan. While the size of revaluation is still being debated (2-5% cited initially) the impact is likely to be positive for commodity prices, particularly those where China is both a large, high-cost producer and a significant consumer. More importantly, it will serve to increase China's reliance on imports by reducing the cost (in RMB) of those commodities where it is a significant net importer. Raising the value of the yuan versus other currencies would cut the cost of China's imports of dollar-denominated commodities such as oil, copper and iron ore, while making Chinese exports more expensive. The greatest impact will probably be seen in bulk commodities such as iron ore, metals such as copper and in soy, where China is a big importer and consumes most of the products made from those imports at home.
China % of world consumption & seaborne production 2010E
Source: JP Morgan
Allowing the yuan to resume appreciation may help China control inflation amid record lending growth and surging property prices. The exchange rate has been kept at about 6.83 per dollar since July 2008 to help Chinese exporters wither the global recession.

Even a rise of 3 percent in the value of the yuan, the range of increase discussed, to around 6.60 to the dollar from last year's average, would have a profound effect on China's $244 billion commodity bill. Last year the country spent around 607 billion yuan ($88.97 billion) on importing oil, 343 billion yuan ($50.28 billion) on iron ore and 206 billion yuan ($30.20 billion) on copper. An increase of 3 percent in the yuan would have saved the nation some 56 billion yuan ($8.21 billion) on its commodity purchases, or enough to buy more than 1 million tonnes of copper.

The last time China raised exchange rates back in 2005, commodities saw a steady rally for more than a year after the revaluation. At that time copper prices doubled to a then record high of $8,800 a tonne in 2006, chipping around half a million tonnes off copper consumption annually.

Source: Bloomberg
The above chart shows the CRB Index, which tracks 19 commodities, the yuan exchange rate in the spot market and 12-month non-deliverable forwards for the currency. The CRB index surged about 10 percent in the first six weeks after China ended its decade-long peg of about 8.3 per dollar in July 2005, and that could be repeated.


Monday, June 1, 2009

Monthly View on Commodities - June 2009

Global Commodity

Commodities jumped, capping the biggest monthly rally in 34 years, as the slumping dollar bolstered demand for energy, metals and crops as a hedge against inflation. The US Dollar Index, headed for its sharpest monthly drop this year, lowest level in five months against a basket of six major currencies, fell 5% on speculation that gains in equities and signs of a global economic rebound will spur demand for higher- yielding assets. Precious metals typically move inversely to the US currency. The Reuters/Jefferies CRB Index climbed as much as 13%, the most rally since July 1974, extending to the highest level since Nov. 2008.

As we approach mid-2009, the global economic outlook has shifted from one of pessimism and fear of the unknown to optimism and a feeling that the worst of the financial crisis and global recession may be behind us. The premise for the recovery in base metals prices has been based on very little evidence; however, the fact that Chinese imports of refined metal have exceeded expectations is not based on any real pick-up in consumption, but more on the shifting of surplus metal from one location to another. The main forces behind this have been Chinese consumer and State Reserves Bureau restocking, and the strong arbitrage trade in Copper, Zinc and Aluminum.

Gold and Silver

Gold jumped 9%, most for a month since November and topped $980 an ounce yesterday. Silver had the biggest monthly increase in 22 years and rocketed 30% higher in May on rising economic optimism and firm gold prices. Prices for bullion moved higher as the dollar sank to its lowest level in five months against the euro and the British pound. The dollar has weakened considerably since March as investors move out of cash holdings and into riskier assets like stocks on hopes for an economic recovery. Investors are also worried that the massive amounts of money the government has been pumping into the system could lead to inflation. That has been a boon for commodities like Gold and Oil. Demand for gold tends to rise when the dollar is weak as investors seek protection against inflation, which can be triggered by a falling greenback.

There is an extreme fear that the U.S. economy may lose its AAA credit rating in due course, and this has been feeding the gold bulls pretty well. Things really aren't improving despite the [stock] market's desire to latch on to every little bit of positive news. The reality is the economy is still struggling quite significantly. Gold holdings in the SPDR Gold Trust, the biggest exchange-traded fund backed by bullion, increased 13.14 metric tons to 1,118.76 metric tons as of May 22

Global gold hedging was unchanged in Q1 2009 from Q4 2008, the first time it had not fallen since Q1 2002. An unusual amount of new project-related hedging and an absence of dehedging from the larger hedgers were behind the stasis. India's gold imports so far in May have been in the range of 10 to 15 tonnes, lower than 29 tonnes imported in all of May of 2008 as high prices have subdued buyers' appetites.


Gold is expected to trade on an upward bias for the next month with resistance of $1000 and may touch new high crossing $1033. This rally would be sustainable if we see some retracement in prices in initial days of the month.

Zinc

Zinc has plenty to gain from the on-going Chinese and US stimulus packages and its price has risen in anticipation. However, industrial activity is about to slacken off even more during the imminent northern hemisphere summer months and this ought to see subdued price volatility, although any further mine closures could offer support. LME zinc stocks have declined, falling to about 10 days worth of consumption, while the three-month price has gained 5% since April to reach $1570/t on 29th May.

Much of the LME stock has been sucked into China to feed state and consumer restocking programmes, which in turn have opened a strong arbitrage trade between the higher Shanghai prices than that of the LME, encouraging further imports. There is little fundamentally in the short-term to keep the price at such a high level, but zinc, more than any other base metal, entered into recessionary territory almost 18 months ago and the amount of mine and smelter production cuts and closures reflects this. It is estimated; about 1.6 Mt of mined zinc production has been cut or closed and 1.4 Mt of refined zinc output in 2009. Importantly, some of the mine closures are likely to be permanent, while others will take time and require financing to restart.

With zinc standing to benefit from the Chinese infrastructure-focused stimulus package more than the other base metals, besides perhaps copper, we expect to see some tightness in the market later in 2009, as some real demand returns. For the next month, we could see some profit booking in the initial days and that would be opportunity to build long position. Zinc is likely to trade higher next month with the resistance $1640 and $1700.

Lead

Lead prices have been in thrall to copper in May, with prices trading wildly in $200/t ranges. LME three-month lead started May at lowest level at $1325/t and ended at highest level of the month at $1570/t. Besides echoing copper, lead’s price strength can be traced to a number of reasons. The normally recession-resistant replacement battery sector, which accounts for about 40% of lead offtake, has benefited from the unusually cold winter in the northern hemisphere.

In addition, it is estimated about 360,000t of lead production has been cut in 2009 due to the severe cuts by zinc miners, as Lead is produced primarily as a by-product from zinc mines. This has tightened the market considerably, leaving LME stocks at no more than three days worth of consumption. Adding to this is the fact that China has become a net importer of lead. In 2007 it exported a net 211,000t, and in 2008 a net 2,700t. In Q1 2009 it imported 48,320t of refined lead, up 826% year-on-year. Also supporting the price was the suspension of US-based Doe Run’s La Oroya lead-zinc-copper smelter in Peru, which produced 114,000t of lead in 2008. It has now restarted, albeit at reduced capacity.

Lead looks the brightest fundamentally of all the base metals besides tin. The low level of LME stocks and tightness in near-term supply will support the price over the next month. For the next month, we could see some profit booking in the initial days and that would be opportunity to build long position. Zinc is likely to trade higher next month with the resistance $1640 and $1700.