
Monday, December 13, 2010

Monday, December 6, 2010
Monday, November 29, 2010
Thursday, September 23, 2010
ALL THAT GLITTERS “ISNT” ONLY GOLD, SILVER IS SHINNING TOO
The U.S. central bank said yesterday that it will continue to monitor the economic outlook and is “prepared to provide additional accommodation if needed to support the economic recovery and to return inflation, over time, to levels consistent with its mandate. The National Bureau of Economic Research said Sept. 20 that the worst U.S. recession since the 1930s ended in June 2009. Still, unemployment in the U.S. may stay above pre-recession levels until at least 2013.
Key drivers for Silver price rise are, continuing safe-haven demand from an uncertain European and U.S. economic backdrop and the emergence of stronger investment demand. On the contrary, high industrial demand from Emerging markets will pave the way for price rise. The world's largest silver-backed exchange-traded fund “ISHARE” is turning bull on the commodity and started increasing its holdings since May 2010 and heading towards breaking the all time high of 9514 tonnes
For the last few years silver has moved in relative tandem with the gold price up to now. We called it the ‘Long shadow of gold’ because it would rise further and fall further than gold, but they did move together. Occasionally silver did pause as gold rose but the ‘shunt’ effect [when a train pulls forward with a line of carriages in tow and each jumps forward as their links tighten] kicked in and it jerked forward to catch up with gold’s moves. Many investors keep their eyes focused on the Gold: Silver Ratio [one ounce of gold buys x number of ounces of silver] and trade it regularly. Right now that ratio is at 1: 62. However, by coupling we also mean will they continue to act and react together on a daily basis, apart from price differentials.
Silver prices are breaking out technically and it is our belief the metal will actually outperform gold in Q410 as investors look for ways to capitalize on upside potential vs the yellow metal. Throughout the gold rally seen over the past few years, silver has largely been seen as the evil stepchild of gold. However, a case can be made that investors are becoming more hip to silver’s allure, especially for portable electronic device battery technology. The growing enthusiasm for silver is most evident by the metal quietly trading near its highest level since 1980
Gold- Silver Ratio
Keep in mind the gold/silver ratio, which measures how many ounces of silver would be needed to buy a troy ounce of gold, was above 72 in 2009. Today the level is below 62. This indicates to us that at current prices investors are viewing silver more and more as an investment alternative to gold.
We'll have to travel in time back to 2003 to find a time when the gold to silver ratio was even remotely close to where it is today. In 2003, the ratio peaked for the last time at nearly 80:1. Since that time, gold has risen from $320 per ounce to $1240 per ounce. Silver, on the other hand, has risen from $4.80 to more than $20 per ounce. Silver racked up a 416% gain in seven years while gold lagged, but still beat any other market with a 387% gain.Going back even further to 1992, silver was selling for an average price of $4 per ounce while gold traded at right around $350. That puts the ratio at roughly an average of 85:1 throughout the year. From 1992 to 1998, when silver reached its recent average ratio to gold, silver soared as high as $7.80 per ounce. Gold, however, stayed moderately flat, advancing no more than 20% and ending the year of 1998 exactly where it began six years prior. Nevertheless, in 1980, the last time silver prices saw a surge before this current rally, the gold/silver ratio was only 17 so those investors still looking to jump on silver express still have time in our opinion.

Now more than ever, appreciation in silver prices is only a matter of time, nearly guaranteed as a result of a changing market structure and a sky-high silver to gold ratio. When investment bank activity shutters for good in October, expect a surge in prices never before seen. Silver's previous seasonal autumn runs will look like blips on the radar, and many investors are positioned well to become filthy rich on the climb. If you haven't already, consider swapping a portion of your gold bullion holdings for physical silver, as history is on your side.
With silver being less liquid than gold, investing in silver could be a more strategic way to capture a larger return in the precious metals space. If silver prices are gaining upside momentum and industrial demand is still fragile, silver could see robust demand for investors when this recession finally shows signs of being over.
At COMEX, Silver is expected to create new highs and trade around $23 in near future. Therefore, I advise to buy MCX Silver around 32300 and hold for 2-3 months for 10% upside for the target of 35500.
Friday, August 27, 2010
BUY GOLD IN AUGUST AND GO AWAY
These monthly seasonal tendencies reinforce the annual analysis. Summers, especially June and July, tend to be weak during the summer doldrums. August looks strong above in monthly terms, but realizes most of these gains merely offset July’s big losses. But once summer passes, Gold tend to rally on balance in most months except October. While they can drift lower other times, these non-summer pullbacks tend to be trivial.
August is the perfect time to stock up and prepare for the highly-probable large autumn (September) gold rally. Gold tends to rally sharply in autumn because of big Asian buying. After harvest, farmers can invest in gold once they know how big their profits are. And gold demand in India in particular, the world’s largest consumer, rockets higher during autumn’s festival season and marriages.

The above chart shows monthly percentage return in COMEX Gold for last 10 years. And it has been concluded, that September and November month gives best return with average of 4.5%.
The bottom line is precious-metals stocks have exhibited very definite seasonal tendencies over the course of their secular bull. This is largely the result of gold demand spikes driven by income-cycle and cultural factors that are tied to the calendar year. While stock seasonals are often secondary drivers that can be temporarily overridden by short-term technical and sentimental extremes, prudent traders still pay close attention to these headwinds and tailwinds
Moreover, World Gold Council published report on Gold Demand Trends for Q2-2010, which suggests demand for gold will remain robust during 2010 as a result of accelerating demand from India and China, as well as increasing global investment demand driven by continuing uncertainty over public debt and economic recovery.
Demand Statistics for Q2-2010
--- Total gold demand in Q2 2010 rose by 36% to 1,050 tonnes, largely reflecting strong gold investment demand compared to the second quarter of 2009. In US$ value terms, demand increased 77% to $40.4 billion.
--- Investment demand was the strongest performing segment during the second quarter, posting a rise of 118% to 534.4 tonnes compared with 245.4 tonnes in Q2 2009.
--- The largest contribution to this rise came from the ETF segment of investment demand, which grew by 414% to 291.3 tonnes, the second highest quarter on record.
--- Physical gold bar demand, which largely covers the non-western markets, rose 29% from Q2 2009 to 96.3 tonnes.
--- Global jewellery demand remained robust in Q2 2010. In the face of surging price levels, consumption totalled 408.7 tonnes during the second quarter of 2010, just 5% below year-earlier levels.
--- Gold jewellery demand in India, the largest jewellery market, was little changed from year-earlier levels, down just 2% at 123.0 tonnes. In local currency terms, this translates to a 20% increase in the value of demand to ` 216 billion.
--- China saw demand for gold jewellery increase by 5% to 75.4 tonnes. While growth in demand in tonnage terms was hindered by extreme weather conditions, the growth in the local currency value measure of demand was 35% to RMB 19.8 billion.
--- With the return of demand for consumer electronics, industrial demand grew by 14% to 107.2 tonnes, compared to Q2 2009.

Outlook
Demand for gold for the rest of 2010 will be underpinned by the following market forces:
--- India and China will continue to provide the main thrust of overall growth in demand, particularly for gold jewellery, for the remainder of 2010.
--- Retail investment will continue to be a substantial source of gold demand in Europe.
--- Over the longer-term, demand for gold in China is expected to grow considerably. A report recently published by The People’s Bank of China and five other organisations to foster the development of the domestic gold market will add impetus to the growth in gold ownership among Chinese consumers.
--- Electronics demand is likely to return to higher historic levels after the sector exhibited further signs of recovery, especially in the US and Japan.
COMEX Gold Weekly Chart

Conclusion
In the coming period, gold may rise further with more expected physical demand from India, the world's largest gold buyer, where festival season begins next week and ends in November.
Scenario Analysis of COMEX Gold
 At COMEX, Gold is currently trading at $1240 and expected to rise at least 5% in September as per seasonality chart shown above, for the target of $1300. At MCX, Gold prices are vulnerable to $/Rs movement, so table above shows the target in Rupee terms.
Currently Gold is traded at Rs 18900 level at MCX which is expected to touch Rs 19500 mark in September yielding the return of more than 3% and in leverage terms, ROI would be 100% in one month.
Long term targets for COMEX Gold are $1350 by November 2010 and $1400 by February 2011.
Wednesday, August 18, 2010
Gold changing correlation with Dollar

How quickly things have changed! On August 11th, the dollar fell to a 15-year low against the yen of ¥84.7. It perked up against the euro to $1.32, though that was still much weaker than the $1.19 it reached in early June when euro-revulsion was at its worst. On August 10th, the Federal Reserve conceded that the recovery would probably be slower than it had hoped. The Fed kept its main interest rate in a target range of 0-0.25% and stuck to its creed that rates would need to stay low for “an extended period”. In addition the central bank said that it would reinvest the proceeds from the maturing mortgage bonds it owns into government bonds to prevent its balance-sheet (and thus the stock of ready cash) from gradually shrinking.
Gold has currently 80% positive correlation with Dollar Index now and this again is expected to reverse as Dollar will lose its shine as US heads for Double Dip Recession. Gold is expected to trade inversely of Dollar Index going ahead. The leading indicators suggest that the probability of a US double-dip recession in the next 6-9 months is around 50-50%. The Economic data are pointing too gloomy picture of US ahead. U.S. trade deficit has widened in June, Job creation is stagnant, Initial weekly claims for unemployment are at the highest level since February, Construction and Home sales are sluggish, and Consumer spending remains weak. Every slim piece of economic data will be put under the microscope by financial markets now onwards in the wake of the Federal Reserve's new caution about the outlook. The data will be sliced and diced and spun in a centrifuge for signs of whether the economy is sinking into an actual double-dip downturn or whether it only has hit a soft patch. Therefore COMEX Gold is expected to cross its record high of $1260 soon and trade above $1300 in next 1-2 months.
Monday, August 2, 2010
US GDP data shows Gross Distorted Position of the Country
The advance estimate of second-quarter GDP growth came in at 2.4%, below the expectation going into the report of 2.7%, underlining a deceleration in growth. That deceleration was made starker still because first-quarter growth was revised up to 3.7%, from the previous 2.7% estimate. The report included revisions going back to 2007, and despite the upward revision to the first quarter, revisions overall reduced historical growth estimates.


Source: US Bureau of Economic Analysis
Thursday, June 17, 2010
Enigma in Natural Gas Market – Is history set to repeat, or Is this time different?
A sharp move in natural-gas-market contracts has caught traders' attention and sparked talk that at least one market participant may have been caught on the wrong side of a trade.
NYMEX Natural Gas Prices and Spread

Source: Bloomberg
Gas prices are typically higher in March, the last month of winter, than in April, when spring temperatures limit the demand for natural gas for heating. A trader expecting an unusually cold winter, for example, would bet on a wide spread between March and April gas prices.
The trade is the same bet that brought down Amaranth Advisors LLC, a
This is peculiar behavior, given that supplies are currently building at a comfortable pace, i.e., whatever the knock-on to gas demand from the situation in the Gulf, it will likely not affect this season’ s refills nor next winter’s deliveries. Moreover, Natural gas

Source: Bloomberg
This then begs the question: are other factors impacting the price path of these spreads? After all, once these spreads lock into a trend they stay on trend, regardless of the underlying fundamental picture. Until last week, the March-April 2011 price spread was very thinly traded because long-term weather forecasts are unreliable, and traders typically don't start making bets on winter gas prices until later in the year. However, both of these spreads of currently decoupled from their respective trends. We haven’t seen these particular spreads behave in such a manner since an Amaranth morphed a $9 billion hedge fund into a $3 billion fund in August 2006. In September 2006, when Amaranth had to reverse its trades, the March-April spread tumbled to as low as 42 cents per million Btu from as high as $2.5 in August. At the time, the spread measured the difference between March 2007 and April 2007 prices
The move in the March-April spread probably wasn't caused by a change in weather forecasts or supply predictions, but there can be two reasons:
CASE I: A trader trying to exit a sizable bet on the spread after a bad wager on something else forced the trader to meet margin calls.
Thursday, June 3, 2010
MONTHLY VIEW ON COMMODITIES - JUN 2010
Commodities in May had their steepest monthly decline in 18 months, with a key sector index Reuters-Jefferies CRB index finished down 8.3 percent for May -- its biggest monthly decline since Lehman Collapse. Macroeconomic affairs continued to dominate price direction in commodities, while fundamentals played second fiddle. The whole last month passed away in solving Greece’s issue as major economic actions took place by European countries and IMF. Germany's parliament approved a $1 trillion safety net to stabilize the euro as fears swirled that Europe's debt crisis and tougher financial regulation may choke economic recovery.
Euro was poised for a sixth monthly loss against the dollar amid concerns Europe’s efforts to reduce fiscal deficits and stem a sovereign-debt crisis will undermine the region’s recovery. The common currency dropped 7.6 percent in May, the longest monthly losing streak since April 2000. Germany has temporarily banned naked short selling of some securities in the European Union to prevent euro’s gain. Euro is expected to trade in range of 1.15 to 1.25 in the month of June
Crude oil futures posted their worst monthly performance since December 2008 declining more than 15% ended at $74 for May 2010. . Oil prices fell to $65 from $86 in the first half as Euro plunged to near 1.21 against dollar curbing investment from oil to precious metals and dollar. Crude oil futures recovered from lows and managed to trade near $75 in the second half as subsequent moves by EU finance ministers to guarantee liquidity for vulnerable economies restored confidence in the world markets.
The most awaiting hurricane season is at the gate and NOAA- National Weather Service projects ‘active to extremely active’ Atlantic Hurricane Season for 2010. There is a 70% chance that three to seven major hurricanes will swirl in the Atlantic in the six months following the start of the hurricane season on June 1, according to NOAA's Climate Prediction Center. A typical season has 11 named storms, six hurricanes and two major hurricanes. Oil prices are expected to trade higher and may see $87 levels facing very volatile sessions on better economic outlook supported by summer driving demand and speculative trades on Hurricane season with support at $65.
Natural Gas futures rallied more than 10% capping the biggest monthly gain after December 2009 ended at $4.34. Natural gas prices managed upward momentum from the previous month as investors hatched the buying opportunity at $4 on higher demand forecast in summer. Natural gas prices are expected to trade higher on summer cooling demand expectation and supplies and shipment disruption problems in GoM due to BP oil spill backed by intense hurricane season forecast. Growing supplies will limit upside with resistance at $4.70 level, support for falling prices lies at $3.80
Gold-“A mask of Gold hides all deformities.” –The statement proved to be correct in the last month as investor around the world rushed for safe heaven demand against probable expectation that Europe’s debt Crisis may stall the global recovery resulting the bullion to make all time high of US $1250 an ounce. ETF’s around the world bet the most on Gold as many of them made the all time high holdings. SPDR, the biggest Exchange traded Fund backed by bullion has added the skyrocketing 109 Metric Tons on a monthly basis making the all time high of holdings at 1268 Metric Tons. Indian Gold Prices also rallied to record high Rs 18700/ 10 gm, rising 7% during the month of May. This rally was supported by 4% depreciation in India Rupee and 3% price rise in COMEX Gold. The expected Price Range for Gold June Month contract is $1170/oz to $1280/oz.
Silver, basically a precious metal but because of it’s large industrial usage often considered as an industrial metal and hence sometimes guided by the metal prices which is what exactly has happened in the last month. Even after strong China’s CPI as well as positive US industrial data Euro pessimism overshadowed the Silver demand in the expectation of slower global recovery resulting the flat ending with the 0.37% in red trading at $18.56/oz. For the June month, we expect the prices to trade in the range of $17/oz to $21/oz.
Base Metals complex nose-dived in the previous month as the debt concerns overhaul in the market coupled with dollar’s rally and mounting speculation that China’s efforts to cool its economy will erode demand from the largest consuming nation. Base metals prices were dominated by mixed sentiments in the market as positive economic data from US and ongoing European crisis meddled with prices. US economic data showed improvements in housing and consumer confidence but only managed to spark brief strength in the counters. For next month, prices of base metals to remain more or less sideways with negative bias during June. Lead and zinc looks negative on lack of real demand, while copper and nickel could see some buying opportunity at lower levels.
Copper closed at Rs 319 per kg, down near 3% in a month. The decline in LME Copper forwards was more than what we saw in Indian futures. LME three-month forward prices settled at $ 6940 per tonne, down by 7%. Inventories were down in May, declining by 22575 tonnes or 4.5% in LME to 476725 tonnes. One Month expected trading range for LME Copper would be $6000/t-$7400/t.
Lead and Zinc futures declined sharply, as risk-averse investors abandoned the volatile base metals market and headed for safe haven investments such as gold. Lead market fundamentals remain weak, at least over the near term. Stockpiles are rising and there is no sign of decreasing output, or increasing demand. Lead for three month delivery on the LME hit $1721 level and closed at $1850, down 17%. Next Month expected trading range for LME Zinc would be $1700/t-$2200/t and Next Month expected trading range for LME Lead would be $1550/t-$1950/t.
Nickel prices have remained relatively strong during the year however last month was skeptical due to jitters in broader markets. Lower Steel prices and declining confidence of investors have affected the prices of Nickel badly. LME 3-month nickel prices came under pressure on Europe sovereign debt default contagion fears and threats of Chinese monetary tightening. LME nickel prices settled at $21350/t, worst performer on metals counter as down by nearly 19%. Next Month expected trading range for LME Nickel would be $19500/t-$22000/t.
Thursday, May 13, 2010
A GREEK TRAGEDY IN THE EUROZONE
External debt (or foreign debt) is that part of the total debt in a country that is owed to creditors outside the country. The debtors can be the government, corporations or private households. The debt includes money owed to private commercial banks, other governments, or international financial institutions such as the IMF and World Bank. This is similar to how an individual’s debt can include business loans, mortgages, credit card debt or student loans. Debt-to-GDP measures financial leverage of an economy.
World Top Twenty Debtors Nations
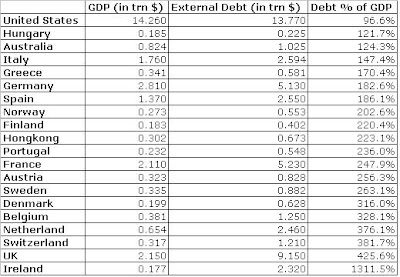 Source: External Debt (2009) information from The World Bank, GDP (2009) information from the CIA World Factbook.
When the European Union (EU) was formed, there was a fiscal deficit limit of 3 percent of GDP, but very few countries have honored that. Greece has a fiscal deficit of 12 percent of its GDP, four times the limit specified in the eurozone agreement. When the Eurozone was formed, its criteria also called for a government’s debt-to-GDP ratio to be below 60 percent—which also hasn’t been honored either.
So what does this mean? According to the World Bank and the IMF, external debt sustainability (the ability of a country to repay foreign debts) should not be more than 250 percent of a country's revenue or 150 percent of exports. Higher external debt is harmful to the economy and most likely will result in default.
So what are the causes of the high debt-to-income ratios in Europe?
Expensive labor.
Expensive exports.
Expensive currency.
Small population.
High levels of taxation and large social welfare systems.
Deficit spending, government debt and private sector borrowing are the norm in most western countries, but due in part to the financial crisis, some nations and economies are in considerably worse debt positions than others.
Most popular rhetoric on the topic would claim that wealthy countries have grown accustomed to being wealthy and they are enthralled by consumerism – it could be argued that this high level of debt could be a result of a culture that is used to and willing to buy now, and pay later…even if it means with interest.
Friday, April 23, 2010
Impact of Yuan Revaluation on Commodities
China % of world consumption & seaborne production 2010E
 Source: JP Morgan
Allowing the yuan to resume appreciation may help China control inflation amid record lending growth and surging property prices. The exchange rate has been kept at about 6.83 per dollar since July 2008 to help Chinese exporters wither the global recession.
Even a rise of 3 percent in the value of the yuan, the range of increase discussed, to around 6.60 to the dollar from last year's average, would have a profound effect on China's $244 billion commodity bill. Last year the country spent around 607 billion yuan ($88.97 billion) on importing oil, 343 billion yuan ($50.28 billion) on iron ore and 206 billion yuan ($30.20 billion) on copper. An increase of 3 percent in the yuan would have saved the nation some 56 billion yuan ($8.21 billion) on its commodity purchases, or enough to buy more than 1 million tonnes of copper.
The last time China raised exchange rates back in 2005, commodities saw a steady rally for more than a year after the revaluation. At that time copper prices doubled to a then record high of $8,800 a tonne in 2006, chipping around half a million tonnes off copper consumption annually.
 Source: Bloomberg
The above chart shows the CRB Index, which tracks 19 commodities, the yuan exchange rate in the spot market and 12-month non-deliverable forwards for the currency. The CRB index surged about 10 percent in the first six weeks after China ended its decade-long peg of about 8.3 per dollar in July 2005, and that could be repeated.
Monday, June 1, 2009
Monthly View on Commodities - June 2009
Global Commodity
Commodities jumped, capping the biggest monthly rally in 34 years, as the slumping dollar bolstered demand for energy, metals and crops as a hedge against inflation. The US Dollar Index, headed for its sharpest monthly drop this year, lowest level in five months against a basket of six major currencies, fell 5% on speculation that gains in equities and signs of a global economic rebound will spur demand for higher- yielding assets. Precious metals typically move inversely to the US currency. The Reuters/Jefferies CRB Index climbed as much as 13%, the most rally since July 1974, extending to the highest level since Nov. 2008.
As we approach mid-2009, the global economic outlook has shifted from one of pessimism and fear of the unknown to optimism and a feeling that the worst of the financial crisis and global recession may be behind us. The premise for the recovery in base metals prices has been based on very little evidence; however, the fact that Chinese imports of refined metal have exceeded expectations is not based on any real pick-up in consumption, but more on the shifting of surplus metal from one location to another. The main forces behind this have been Chinese consumer and State Reserves Bureau restocking, and the strong arbitrage trade in Copper, Zinc and Aluminum.
Gold and Silver
Gold jumped 9%, most for a month since November and topped $980 an ounce yesterday. Silver had the biggest monthly increase in 22 years and rocketed 30% higher in May on rising economic optimism and firm gold prices. Prices for bullion moved higher as the dollar sank to its lowest level in five months against the euro and the British pound. The dollar has weakened considerably since March as investors move out of cash holdings and into riskier assets like stocks on hopes for an economic recovery. Investors are also worried that the massive amounts of money the government has been pumping into the system could lead to inflation. That has been a boon for commodities like Gold and Oil. Demand for gold tends to rise when the dollar is weak as investors seek protection against inflation, which can be triggered by a falling greenback.
There is an extreme fear that the U.S. economy may lose its AAA credit rating in due course, and this has been feeding the gold bulls pretty well. Things really aren't improving despite the [stock] market's desire to latch on to every little bit of positive news. The reality is the economy is still struggling quite significantly. Gold holdings in the SPDR Gold Trust, the biggest exchange-traded fund backed by bullion, increased 13.14 metric tons to 1,118.76 metric tons as of May 22
Global gold hedging was unchanged in Q1 2009 from Q4 2008, the first time it had not fallen since Q1 2002. An unusual amount of new project-related hedging and an absence of dehedging from the larger hedgers were behind the stasis. India's gold imports so far in May have been in the range of 10 to 15 tonnes, lower than 29 tonnes imported in all of May of 2008 as high prices have subdued buyers' appetites.
Gold is expected to trade on an upward bias for the next month with resistance of $1000 and may touch new high crossing $1033. This rally would be sustainable if we see some retracement in prices in initial days of the month.
Zinc
Zinc has plenty to gain from the on-going Chinese and US stimulus packages and its price has risen in anticipation. However, industrial activity is about to slacken off even more during the imminent northern hemisphere summer months and this ought to see subdued price volatility, although any further mine closures could offer support. LME zinc stocks have declined, falling to about 10 days worth of consumption, while the three-month price has gained 5% since April to reach $1570/t on 29th May.
Much of the LME stock has been sucked into China to feed state and consumer restocking programmes, which in turn have opened a strong arbitrage trade between the higher Shanghai prices than that of the LME, encouraging further imports. There is little fundamentally in the short-term to keep the price at such a high level, but zinc, more than any other base metal, entered into recessionary territory almost 18 months ago and the amount of mine and smelter production cuts and closures reflects this. It is estimated; about 1.6 Mt of mined zinc production has been cut or closed and 1.4 Mt of refined zinc output in 2009. Importantly, some of the mine closures are likely to be permanent, while others will take time and require financing to restart.
With zinc standing to benefit from the Chinese infrastructure-focused stimulus package more than the other base metals, besides perhaps copper, we expect to see some tightness in the market later in 2009, as some real demand returns. For the next month, we could see some profit booking in the initial days and that would be opportunity to build long position. Zinc is likely to trade higher next month with the resistance $1640 and $1700.
Lead
Lead prices have been in thrall to copper in May, with prices trading wildly in $200/t ranges. LME three-month lead started May at lowest level at $1325/t and ended at highest level of the month at $1570/t. Besides echoing copper, lead’s price strength can be traced to a number of reasons. The normally recession-resistant replacement battery sector, which accounts for about 40% of lead offtake, has benefited from the unusually cold winter in the northern hemisphere.
In addition, it is estimated about 360,000t of lead production has been cut in 2009 due to the severe cuts by zinc miners, as Lead is produced primarily as a by-product from zinc mines. This has tightened the market considerably, leaving LME stocks at no more than three days worth of consumption. Adding to this is the fact that China has become a net importer of lead. In 2007 it exported a net 211,000t, and in 2008 a net 2,700t. In Q1 2009 it imported 48,320t of refined lead, up 826% year-on-year. Also supporting the price was the suspension of US-based Doe Run’s La Oroya lead-zinc-copper smelter in Peru, which produced 114,000t of lead in 2008. It has now restarted, albeit at reduced capacity.
Lead looks the brightest fundamentally of all the base metals besides tin. The low level of LME stocks and tightness in near-term supply will support the price over the next month. For the next month, we could see some profit booking in the initial days and that would be opportunity to build long position. Zinc is likely to trade higher next month with the resistance $1640 and $1700.
Monday, April 27, 2009
Weekly Commentary on Bullion
Gold is becoming expensive again after the International Monetary Fund (IMF) warned that the global recession could last longer than expected. Forecasts for the current year are already pessimistic and there are fears 2010 could also be problematic. This might be prompting global investments in gold, which is considered one of the safest avenues of investment in times of economic distress and uncertainty. The International Monetary Fund calculates global losses tied to bad loans and securitized assets may reach $4.1 trillion next year. It estimates banks face further writedowns of $550 billion in the U.S. and $750 billion in the euro area
China Government has declared that it has bought 454 tonnes of Gold for its reserves since 2003 to 2008 and current Gold reserves stand at 1054 tonnes, making it fifth largest Gold reserve in the world. China's gold buying has been rumored for years, but the country stayed quiet so as not to limit its ability to find favorable prices.
The world leader in gold reserves is United States with 8133 tonnes as on September 2008 that accounts for 76.5% of its foreign exchange reserves. Germany has the second highest gold reserves at 3412.6 tonnes while IMF has 3217, France has 2508 tonnes constituting 58.7% of its forex assets. Italy has 2451.8 tonnes constituting 61.9% of forex reserves followed by Switzerland at 1040 constituting 23.8% of total forex reserves. India is way down at 14th position with gold reserves of 357.7 tonnes representing 3% of total forex reseres.
What's really pushing gold higher is India's buying festival and continued jitters about U.S. banks' stress test results. Around 10 tons of gold have already been imported this month. India will import 25 to 30 metric tons of gold in April after no imports in the last two months due to Akshaya Tritya which falls on 27 April 2009.
TECHNICAL VIEW
COMEX Gold has support at $890 and resistance at $920 and $935. Prices took support at 200 DMA at $860 lat week as suggested. And Prices have sustained above $900 to resume its uptrend.
Buy MCX Gold (Jun) above 14700 SL 14500 Tgt 15000
COMEX Silver has support at $12.4 and resistance at $13 and $13.4
Buy MCX Silver (May) above 21250 SL 20800 Tgt 22000
Monday, April 13, 2009
Weekly View on Bullion
Gold fell sharply on last Black Monday to touch $865 on back of the news of the UK official at G20 Meeting proposing of the IMF to sell 403 tonnes gold reserves in order to raise cash in G20 Meeting last week. Silver prices also fell Rs 1000 in a single day. But it was overdone and prices started recovering rest of the week due to weak economic data released. US Consumer confidence slipped in March as people fretted about rising job losses and a deepening recession. Federal Reserve officials feared the U.S. economy might fall into a self-reinforcing cycle of rising unemployment and slumping business and consumer spending, making credit tighter in a weak financial system, minutes of the Federal Reserve’s March meeting show
Another round of negative news of US economy was released on Thursday. The number of continuing jobless claims - those drawn by workers collecting benefits for more than one week in the week ended March 28 - surged another 95,000 to 5,840,000, the highest level since the government started keeping track in 1967. Continuing claims have risen 12-straight weeks and are up well over one million since the start of the year. The unemployment rate for workers with unemployment insurance rose 0.1 percentage point to 4.4%, a 26-year high.
According to Gold Survey 2009 released by GFMS Ltd on Tuesday, it revealed, Gold will re-attain the $1000 mark in the coming months and even break the $1,100 barrier. It also stressed that Global gold mine supply contracted by almost 3% in 2008 resulting in production levels falling to a 12-year low and Indonesia output decreased by 35%, South Africa, 14% and Australia 13%.
Demand is likely to pick up in India in coming days to marriage season and festivals coming through and lower prices will attract buying in this counter. Kerala, Assam and some other north-eastern states will celebrate Vishu (Bihu) in a big way on April 14, and that is an auspicious occasion for people to start new things or buy gold. Again, Akshaya Tritiya, India’s two biggest gold-buying festivals along with Dhanteras, falls on April 27 when citizens, especially in the south, are expected to buy gold regardless of price, as they believe it will ensure lasting prosperity.
TECHNICAL VIEW
COMEX Gold has support at $865 and resistance at $890 and $905.
Buy MCX Gold (Jun) above 14450 SL 14200 Tgt 14750
COMEX Silver has support at $12 and resistance at $13
Buy MCX Silver (May) above 20750 SL 20350 Tgt 21150 and 21450
Monday, March 23, 2009
Weekly View on Bullion
FUNDAMENTAL COMMENTS AND VIEW
Gold has long been seen as a haven against inflation and the Fed’s announcement earlier this week that it is to inject more than $1 trillion into the US economy was well-received by markets worldwide but also fuelled fears of inflation down the road, hitting the value of the dollar and also prompting a surge in gold prices. The US Federal Reserve is to embark on quantitative easing by buying up longer-term Treasuries for the first time as part of a $1.15 trillion spending spree with the aim of reviving the American economy out of recession. FED will buy $300bn of US government securities, it plans to buy up to $750bn of additional agency mortgage-backed securities and double the agency debt it plans to buy this year from $100bn to $200bn. Gold prices spiked again on the back of the US's move to massive qualitative easing measures. Greenback weakness and inflation are two of gold’s friends, when it comes to pricing the commodity.
The FOMC’s decision to keep the benchmark rate in a spread between zero and 0.25 percent wasn’t market moving; but the announcement that they would actively pursue quantitative easing was. While policy officials have given considerable forewarning to such a move, it nonetheless raises concern about the health of the US economy and its assets
With gold so hot at the moment—SPDR Gold Trust, the world's largest gold-backed ETF, yesterday reported that having added 335 tonnes of gold so far this year its reserves have hit an all-time high of 1,114.6 tonnes. We continue our bullish stance on Gold and Silver.
TECHNICAL VIEW
COMEX Gold has support at $945 and $930 and resistance at $980 and $1000.
Buy MCX Gold (Apr) if prices sustain above 15550 SL 15350 Tgt 15800
COMEX Silver has support at $13.4 and resistance at $14.1 and $14.6
Buy MCX Silver (May) on dips around 22600 SL 22300 Tgt 23000 and 23300
Monday, March 16, 2009
Weekly View on Bullion
The bullion market showed some wild fluctuations during the week. Clearly seeing the narrowest US Trade Balance in six years served to undermine some flight to quality bulls. Gold was battling profit taking by the longs, which might have been somewhat concerned about potential developments from the weekend G20 meeting. With price action choppy the metal may have been underpinned by comments from China's Central Bank warning that the financial crisis may lift gold to record highs. Strong investor flows into gold-backed securities along with currency devaluation concerns may have been other factor providing price support to the metal.
The Swiss franc is one of the traditional safe haven assets, a place where worried investors park money to escape turmoil in other markets. Interest rates are usually low, but Switzerland's conservative fiscal policies and stable economy make it a place where investors attempt to ride out a storm. But the SNB clearly signalled yesterday that it is unwilling to tolerate any further CHF appreciation and acted to sell the currency in the FX markets.
This improves the relative appeal of gold, also a safe haven asset, as it weakens the argument for owning the Swiss franc as an appreciating currency during difficult times. It may also persuade some Swiss-based investors to add to their positions in gold now that the risk of CHF appreciation has been eliminated. Gold did move higher immediately after the SNB intervention yesterday and could benefit further from these moves as investors re-assess their options after this change
China’s Premier Wen Jiabao said he is "worried" about the country’s holdings of US Treasuries and wants assurances that the investment is safe. China is the biggest holder of US debt. Should China or some other significant buyer of US debt announce that they will no longer buy US debt unless denominated in a non-US dollar currency, gold is going to the moon.
The holdings of the SPDR Gold Trust advanced to another record high of 1042 tonnes. The fund now has world's sixth-largest stockpile of gold; overtaking that held by the Swiss National Bank
Technical View
Gold continues to resist any sustained decline, bouncing back quickly from any minor sell off COMEX Gold has support at $900 and $885 and resistance at $965 and $1000.
Buy MCX Gold (Apr) ) if prices sustain above 15450 SL 15200 Tgt 15800
COMEX Silver has support at $12.5 and resistance at $13.5 and $14
Buy MCX Silver (May) ) if prices sustain above 22400 SL 22000 Tgt 22800 and 23000
Monday, March 2, 2009
Weekly View on Bullion
FUNDAMENTAL COMMENTS AND VIEW
Gold has become wealth insurance. Banks are being nationalized as their central banks increase their physical gold reserves. The world financial system is crashing down before us little by little. The fact is we have entered a depression. Close to 14 trillion dollars has been injected into the financial system
The US GDP news released on Friday was the worst since 1982! The economy shrank at an annualized rate of 6.2% in the 4th quarter of 2008 against the expectation of 5.4%. The U.S. dollar index rose as traders now see it as the only fiat currency with safe haven status because they believe the rest of the world is even worse off than the US heading forward.
The rupee hit an all-time low of 51 per dollar on Friday, taking losses this year to 4.5 percent. The currency had fallen 19.1 percent in 2008. The depreciating rupee is support the Indian Gold prices above 15000 Rs / 10 gm. Prices in India have hit record highs over the past few weeks, partly reflecting a sharp depreciation in the value of the rupee that has made dollar-priced gold costlier.
India has not imported any gold so far in February as high prices dampened demand in the world's largest market for the metal and the outlook in the coming weeks remains downbeat. India, which annually buys 500-700 tonnes of gold, had imported 23 tonnes in last February.
According GFMS, there could be major changes in demand pattern in Gold Demand in 2009 with compare to 2008 due to higher prices. Jewellery Demand is expected to fall by 47% from 2146 tonnes to 2000 tonnes. Industrial Demand is expected to fall by 20% in line with current recession from 437 tonnes to 350 tonnes. But Gold ETF Demand is expected to rise more than 100% from 307 tonnes to more than 700 tonnes.
TECHNICAL View
Five day of declines brought gold prices to nearly 9% under last Friday's $1007 peak, and sent speculators wondering about whether the 'correction' label still applies to this week's action. On the other hand, the metal averaged a monthly price in February, which has not been as high since last year's final tally in March.
From the rally of $820 in Jan to $1007 in Feb, Gold prices have corrected and retraced 38.2% to $930 from highs. Prices are expected to bounce back next week. If prices sustain below $930, we could see the levels of $885. COMEX Gold has support at $925 and $900 and resistance at $962 and $977.
Buy MCX Gold (Apr) above 15650 SL 15400 Tgt 16000
COMEX Silver has support at $12.8 and resistance at $13.35 and $13.75
Buy MCX Silver (May) above 22600 SL 21900 Tgt 23200 and 23500
Tuesday, February 24, 2009
Weekly View on Bullion
Gold hit the magical number of “$1,000” in Friday trading session at the COMEX and immediately registered newswire flashes across the various services. This is only the second time in its history that gold has shot up above the $1,000 level. Generally short-term oriented traders like to book profits when such things occur so it will not be unexpected to see a bit of a pullback from here.
If the market does set back, I do not expect any subsequent price retracement to be very deep this time around. Things have changed since last March 2008 (a year ago), the last time gold was over $1,000. The price rise this time has been measured, it has been steady, and most importantly, it has not been driven by a rush of hot fund money into the market. The open interest is 60% of what it was the last time the price of gold peaked – while there is a sizeable long position in the COMEX gold market, it is well off the levels it reached at that last peak. Also, the reported holdings in the gold ETF, GLD, show that investment money is steadily flowing into this sector. The last time gold was over $1,000 back in March, the reported gold holdings were only 663 tons. As of yesterday, holdings were reported at 1029 tons. Obviously a much larger share of the public is moving into gold. I am hard-pressed to see a reason why all this money would suddenly decide to abandon gold unless of course an economic miracle recovery was to immediately commence.
Panic selling in the equities market pushed April gold above the July high and to the highest price level since March of last year. Ongoing concerns over rising risk to European banks due to their high exposure to eastern European economies added to the safe haven buying in gold. Strong investment buying interest continued to flow to the gold market on rumors that the government may consider nationalizing some banks. A sharp reversal in the dollar during the selling may have provided some additional support. Gold trimmed gains on profit taking after comments by the White House supporting a private US banking system triggered a sharp bounce in equities
The euro reversed an early decline against the dollar on Friday, climbing slightly after the German government's economic stimulus plan cleared its final legislative hurdle and the head of the European Central Bank said money markets had seen improvements. The euro also got support from ECB President Jean-Claude Trichet, who told reporters at the European American Press Club in Paris that money market conditions had "improved tremendously" given the bank's recent actions and "there is no weak link in the euro area," a nod to concern about the fiscal health of Ireland, Portugal, Italy and Spain. The financial situation remains extremely fragile and gold seems to be the only safe haven.
Technical View
COMEX Gold has support at $950 and $980 and resistance at $1010 and $1035.
Buy MCX Gold (Apr) on dips around 15650-15700 SL 15400 Tgt 16000 and 16200
COMEX Silver has support at $13.9 and resistance at $15
Buy MCX Silver (Mar) on dips around 22900-23000 SL 22500 Tgt 24000
Monday, February 9, 2009
Weekly View on Commodity
Bullion
The Labor Department reported the U.S. unemployment rate hit 7.6% in January, the highest since 1982. Economists had expected an unemployment rate of 7.5%. The Federal Reserve has cut its key interest rate to near zero in order to boost the economy, and the Bank of England lowered its benchmark rate to a record low of 1% on Thursday. Gold continues to benefit from destructive monetary policies which are being pursued globally.
Gold holdings in the SPDR Gold Trust, the biggest exchange-traded fund backed by bullion, gained to a record for the 11th time in more than two weeks, according to figures on the company's Web site. The fund held 867.19 metric tons of bullion as of yesterday, compared with 8.09 tons when it began Nov. 18, 2004.
Hopes rose that the U.S. will pass a stimulus plan quickly after the Labor Department reported Nonfarm payrolls shed 598,000 jobs, the largest amount since 1974. The U.S. stock market rallied Friday amid hopes bad economic news is already priced in, and that the stimulus plan will boost the economy by the end of the year. The U.S. Senate is slated to vote early next week on an economic stimulus package totaling at least $780 billion that President Barack Obama said is needed to prevent the economy from sinking into a deeper recession.
Dubai gold jewellery sales have reportedly crashed in January as high bullion prices and the economic crisis hit tourism arrivals despite heavy promotional activities during the annual Dubai Shopping Festival (DSF) taking place from 15 January-15 February. Sales have crashed by over 60% in January.
COMEX Gold has support at $900 and resistance at $930 and $950.
Buy MCX Gold (Apr) above 14400 SL 14100 Tgt 14650
Sell MCX Gold (Apr) below 14100 SL 14380 Tgt13800
COMEX Silver has support at $12.7 and resistance at $13.8
Buy MCX Silver (Mar) above 20550 SL 20000 Tgt 22200
Sell MCX Silver (Mar) below 20000 SL 20500 Tgt 19500 and 19200
Energy
Downside continues in crude oil with monotonous choppy trading sessions through out the week. Despite poor economic data prices manage to steady above $40 due to significant production cut by OPEC on agreed quota.
The unemployment rate rose to 7.60% at 18 years high in U.S. The jobless number is also lowest since 34 years signaling that the recession in the world’s biggest energy- consuming country is deepening. The OPEC is implementing pledged production cuts and is committed to restoring balance to the market as the spreading recession reduces demand for oil. The Organization of Petroleum Exporting Countries is going to keep oil shipments steady at a five-year low in the next four weeks.
Natural Gas prices continue to trade higher despite lower crude oil prices. Natural Gas prices rose on lower temperature and on speculation that government efforts to boost the economy gas will increase fuel use. Some refiners switch to summer grade product from winter grade expecting demand in summer season as the future contract is trading lower as compare to previous year April contract.
The president Obama’s stimulus package will definitely help to boost the prices but if we look at the world economic condition, the picture is more darken. The recession is getting deepen and more and more countries are coming under effect. The current going “contago” is also a major worry for oil prices as prices are trading around $5 above the current contract. Support for crude oil lies near $37 and $35.
Sell MCX Crude Oil (Feb) below 1930 SL 2030 TGT 1830 & 1810
Tuesday, February 3, 2009
Weekly Commentary on Bullion
The recent rise in risk aversion has triggered strong inflows into the gold ETFs and a simultaneous increase in demand for gold coins and small investment bars. On December 17th 2008 the combined gold holdings of the World Gold Council gold Exchange Traded Funds and Barclays Gold Trust stood at 985.59 tonnes. By the 16th January 2009 this had risen to 1009.92. By 30th January early in London time they had grown to 1079.83 a growth of almost 70 tonnes in two weeks. To give one perspective, the Central Bank Gold Agreement signatories [European central banks only] sold only 3.5 tonnes in the last two weeks. There are many other gold bullion-holding funds in the developed world from Canada to Switzerland that are not included in this total. If they were the total would be approaching 1200+ tonnes. Clearly we are seeing a stampede of institutional fund management into gold at present.
Central Banks in the Gold Market
The Central Banks of the world are the largest holders of gold in themselves, despite that unquantifiable fact that around 20,000 tonnes of gold are held privately across the Indian sub-continent. So as to give us a sense of proportion on the top cats in the neighborhood, here are the current gold holdings of the top 9 central banks in the world. If we are to take the entire privately held gold Exchange Traded Fund shares they would represent more gold than held by the Swiss National Bank, Switzerland’s central bank. Japan was overtaken a long time ago. Take the world Council gold Exchange Traded Funds and the Gold Trust totals and at the present level of demand the next fortnight will see them overtake Switzerland alone.
Bullion is not in any correlation with Crude Oil and Dollar from last one month. Euro Dollar fell 1.25% during the week and Crude Oil also fell 10% but Gold gained 3% during the week. Silver also followed Gold by rising 5%. This uptrend is likely to continue due to fund buying.
COMEX Gold has support at $900 and resistance at $950 and $990.
Buy MCX Gold (Apr) on dips ~14100 SL 13900 Tgt 14500
COMEX Silver has support at $12 and resistance at $13
Buy MCX Silver (Mar) on dips ~19500 SL 18900 Tgt 20400

 Ahmedabad Time