
Monday, December 13, 2010
Monday, December 6, 2010
Monday, November 29, 2010
Thursday, September 23, 2010
ALL THAT GLITTERS “ISNT” ONLY GOLD, SILVER IS SHINNING TOO
The U.S. central bank said yesterday that it will continue to monitor the economic outlook and is “prepared to provide additional accommodation if needed to support the economic recovery and to return inflation, over time, to levels consistent with its mandate. The National Bureau of Economic Research said Sept. 20 that the worst U.S. recession since the 1930s ended in June 2009. Still, unemployment in the U.S. may stay above pre-recession levels until at least 2013.
Key drivers for Silver price rise are, continuing safe-haven demand from an uncertain European and U.S. economic backdrop and the emergence of stronger investment demand. On the contrary, high industrial demand from Emerging markets will pave the way for price rise. The world's largest silver-backed exchange-traded fund “ISHARE” is turning bull on the commodity and started increasing its holdings since May 2010 and heading towards breaking the all time high of 9514 tonnes
For the last few years silver has moved in relative tandem with the gold price up to now. We called it the ‘Long shadow of gold’ because it would rise further and fall further than gold, but they did move together. Occasionally silver did pause as gold rose but the ‘shunt’ effect [when a train pulls forward with a line of carriages in tow and each jumps forward as their links tighten] kicked in and it jerked forward to catch up with gold’s moves. Many investors keep their eyes focused on the Gold: Silver Ratio [one ounce of gold buys x number of ounces of silver] and trade it regularly. Right now that ratio is at 1: 62. However, by coupling we also mean will they continue to act and react together on a daily basis, apart from price differentials.
Silver prices are breaking out technically and it is our belief the metal will actually outperform gold in Q410 as investors look for ways to capitalize on upside potential vs the yellow metal. Throughout the gold rally seen over the past few years, silver has largely been seen as the evil stepchild of gold. However, a case can be made that investors are becoming more hip to silver’s allure, especially for portable electronic device battery technology. The growing enthusiasm for silver is most evident by the metal quietly trading near its highest level since 1980
Gold- Silver Ratio
Keep in mind the gold/silver ratio, which measures how many ounces of silver would be needed to buy a troy ounce of gold, was above 72 in 2009. Today the level is below 62. This indicates to us that at current prices investors are viewing silver more and more as an investment alternative to gold.
We'll have to travel in time back to 2003 to find a time when the gold to silver ratio was even remotely close to where it is today. In 2003, the ratio peaked for the last time at nearly 80:1. Since that time, gold has risen from $320 per ounce to $1240 per ounce. Silver, on the other hand, has risen from $4.80 to more than $20 per ounce. Silver racked up a 416% gain in seven years while gold lagged, but still beat any other market with a 387% gain.Going back even further to 1992, silver was selling for an average price of $4 per ounce while gold traded at right around $350. That puts the ratio at roughly an average of 85:1 throughout the year. From 1992 to 1998, when silver reached its recent average ratio to gold, silver soared as high as $7.80 per ounce. Gold, however, stayed moderately flat, advancing no more than 20% and ending the year of 1998 exactly where it began six years prior. Nevertheless, in 1980, the last time silver prices saw a surge before this current rally, the gold/silver ratio was only 17 so those investors still looking to jump on silver express still have time in our opinion.

Now more than ever, appreciation in silver prices is only a matter of time, nearly guaranteed as a result of a changing market structure and a sky-high silver to gold ratio. When investment bank activity shutters for good in October, expect a surge in prices never before seen. Silver's previous seasonal autumn runs will look like blips on the radar, and many investors are positioned well to become filthy rich on the climb. If you haven't already, consider swapping a portion of your gold bullion holdings for physical silver, as history is on your side.
With silver being less liquid than gold, investing in silver could be a more strategic way to capture a larger return in the precious metals space. If silver prices are gaining upside momentum and industrial demand is still fragile, silver could see robust demand for investors when this recession finally shows signs of being over.
At COMEX, Silver is expected to create new highs and trade around $23 in near future. Therefore, I advise to buy MCX Silver around 32300 and hold for 2-3 months for 10% upside for the target of 35500.
Friday, August 27, 2010
BUY GOLD IN AUGUST AND GO AWAY
These monthly seasonal tendencies reinforce the annual analysis. Summers, especially June and July, tend to be weak during the summer doldrums. August looks strong above in monthly terms, but realizes most of these gains merely offset July’s big losses. But once summer passes, Gold tend to rally on balance in most months except October. While they can drift lower other times, these non-summer pullbacks tend to be trivial.
August is the perfect time to stock up and prepare for the highly-probable large autumn (September) gold rally. Gold tends to rally sharply in autumn because of big Asian buying. After harvest, farmers can invest in gold once they know how big their profits are. And gold demand in India in particular, the world’s largest consumer, rockets higher during autumn’s festival season and marriages.

The above chart shows monthly percentage return in COMEX Gold for last 10 years. And it has been concluded, that September and November month gives best return with average of 4.5%.
The bottom line is precious-metals stocks have exhibited very definite seasonal tendencies over the course of their secular bull. This is largely the result of gold demand spikes driven by income-cycle and cultural factors that are tied to the calendar year. While stock seasonals are often secondary drivers that can be temporarily overridden by short-term technical and sentimental extremes, prudent traders still pay close attention to these headwinds and tailwinds
Moreover, World Gold Council published report on Gold Demand Trends for Q2-2010, which suggests demand for gold will remain robust during 2010 as a result of accelerating demand from India and China, as well as increasing global investment demand driven by continuing uncertainty over public debt and economic recovery.
Demand Statistics for Q2-2010
--- Total gold demand in Q2 2010 rose by 36% to 1,050 tonnes, largely reflecting strong gold investment demand compared to the second quarter of 2009. In US$ value terms, demand increased 77% to $40.4 billion.
--- Investment demand was the strongest performing segment during the second quarter, posting a rise of 118% to 534.4 tonnes compared with 245.4 tonnes in Q2 2009.
--- The largest contribution to this rise came from the ETF segment of investment demand, which grew by 414% to 291.3 tonnes, the second highest quarter on record.
--- Physical gold bar demand, which largely covers the non-western markets, rose 29% from Q2 2009 to 96.3 tonnes.
--- Global jewellery demand remained robust in Q2 2010. In the face of surging price levels, consumption totalled 408.7 tonnes during the second quarter of 2010, just 5% below year-earlier levels.
--- Gold jewellery demand in India, the largest jewellery market, was little changed from year-earlier levels, down just 2% at 123.0 tonnes. In local currency terms, this translates to a 20% increase in the value of demand to ` 216 billion.
--- China saw demand for gold jewellery increase by 5% to 75.4 tonnes. While growth in demand in tonnage terms was hindered by extreme weather conditions, the growth in the local currency value measure of demand was 35% to RMB 19.8 billion.
--- With the return of demand for consumer electronics, industrial demand grew by 14% to 107.2 tonnes, compared to Q2 2009.

Outlook
Demand for gold for the rest of 2010 will be underpinned by the following market forces:
--- India and China will continue to provide the main thrust of overall growth in demand, particularly for gold jewellery, for the remainder of 2010.
--- Retail investment will continue to be a substantial source of gold demand in Europe.
--- Over the longer-term, demand for gold in China is expected to grow considerably. A report recently published by The People’s Bank of China and five other organisations to foster the development of the domestic gold market will add impetus to the growth in gold ownership among Chinese consumers.
--- Electronics demand is likely to return to higher historic levels after the sector exhibited further signs of recovery, especially in the US and Japan.
COMEX Gold Weekly Chart

Conclusion
In the coming period, gold may rise further with more expected physical demand from India, the world's largest gold buyer, where festival season begins next week and ends in November.
Scenario Analysis of COMEX Gold
 At COMEX, Gold is currently trading at $1240 and expected to rise at least 5% in September as per seasonality chart shown above, for the target of $1300. At MCX, Gold prices are vulnerable to $/Rs movement, so table above shows the target in Rupee terms.
Currently Gold is traded at Rs 18900 level at MCX which is expected to touch Rs 19500 mark in September yielding the return of more than 3% and in leverage terms, ROI would be 100% in one month.
Long term targets for COMEX Gold are $1350 by November 2010 and $1400 by February 2011.
Wednesday, August 18, 2010
Gold changing correlation with Dollar

How quickly things have changed! On August 11th, the dollar fell to a 15-year low against the yen of ¥84.7. It perked up against the euro to $1.32, though that was still much weaker than the $1.19 it reached in early June when euro-revulsion was at its worst. On August 10th, the Federal Reserve conceded that the recovery would probably be slower than it had hoped. The Fed kept its main interest rate in a target range of 0-0.25% and stuck to its creed that rates would need to stay low for “an extended period”. In addition the central bank said that it would reinvest the proceeds from the maturing mortgage bonds it owns into government bonds to prevent its balance-sheet (and thus the stock of ready cash) from gradually shrinking.
Gold has currently 80% positive correlation with Dollar Index now and this again is expected to reverse as Dollar will lose its shine as US heads for Double Dip Recession. Gold is expected to trade inversely of Dollar Index going ahead. The leading indicators suggest that the probability of a US double-dip recession in the next 6-9 months is around 50-50%. The Economic data are pointing too gloomy picture of US ahead. U.S. trade deficit has widened in June, Job creation is stagnant, Initial weekly claims for unemployment are at the highest level since February, Construction and Home sales are sluggish, and Consumer spending remains weak. Every slim piece of economic data will be put under the microscope by financial markets now onwards in the wake of the Federal Reserve's new caution about the outlook. The data will be sliced and diced and spun in a centrifuge for signs of whether the economy is sinking into an actual double-dip downturn or whether it only has hit a soft patch. Therefore COMEX Gold is expected to cross its record high of $1260 soon and trade above $1300 in next 1-2 months.
Monday, August 2, 2010
US GDP data shows Gross Distorted Position of the Country
The advance estimate of second-quarter GDP growth came in at 2.4%, below the expectation going into the report of 2.7%, underlining a deceleration in growth. That deceleration was made starker still because first-quarter growth was revised up to 3.7%, from the previous 2.7% estimate. The report included revisions going back to 2007, and despite the upward revision to the first quarter, revisions overall reduced historical growth estimates.


Source: US Bureau of Economic Analysis
Thursday, June 17, 2010
Enigma in Natural Gas Market – Is history set to repeat, or Is this time different?
A sharp move in natural-gas-market contracts has caught traders' attention and sparked talk that at least one market participant may have been caught on the wrong side of a trade.
NYMEX Natural Gas Prices and Spread

Source: Bloomberg
Gas prices are typically higher in March, the last month of winter, than in April, when spring temperatures limit the demand for natural gas for heating. A trader expecting an unusually cold winter, for example, would bet on a wide spread between March and April gas prices.
The trade is the same bet that brought down Amaranth Advisors LLC, a
This is peculiar behavior, given that supplies are currently building at a comfortable pace, i.e., whatever the knock-on to gas demand from the situation in the Gulf, it will likely not affect this season’ s refills nor next winter’s deliveries. Moreover, Natural gas

Source: Bloomberg
This then begs the question: are other factors impacting the price path of these spreads? After all, once these spreads lock into a trend they stay on trend, regardless of the underlying fundamental picture. Until last week, the March-April 2011 price spread was very thinly traded because long-term weather forecasts are unreliable, and traders typically don't start making bets on winter gas prices until later in the year. However, both of these spreads of currently decoupled from their respective trends. We haven’t seen these particular spreads behave in such a manner since an Amaranth morphed a $9 billion hedge fund into a $3 billion fund in August 2006. In September 2006, when Amaranth had to reverse its trades, the March-April spread tumbled to as low as 42 cents per million Btu from as high as $2.5 in August. At the time, the spread measured the difference between March 2007 and April 2007 prices
The move in the March-April spread probably wasn't caused by a change in weather forecasts or supply predictions, but there can be two reasons:
CASE I: A trader trying to exit a sizable bet on the spread after a bad wager on something else forced the trader to meet margin calls.
Thursday, June 3, 2010
MONTHLY VIEW ON COMMODITIES - JUN 2010
Commodities in May had their steepest monthly decline in 18 months, with a key sector index Reuters-Jefferies CRB index finished down 8.3 percent for May -- its biggest monthly decline since Lehman Collapse. Macroeconomic affairs continued to dominate price direction in commodities, while fundamentals played second fiddle. The whole last month passed away in solving Greece’s issue as major economic actions took place by European countries and IMF. Germany's parliament approved a $1 trillion safety net to stabilize the euro as fears swirled that Europe's debt crisis and tougher financial regulation may choke economic recovery.
Euro was poised for a sixth monthly loss against the dollar amid concerns Europe’s efforts to reduce fiscal deficits and stem a sovereign-debt crisis will undermine the region’s recovery. The common currency dropped 7.6 percent in May, the longest monthly losing streak since April 2000. Germany has temporarily banned naked short selling of some securities in the European Union to prevent euro’s gain. Euro is expected to trade in range of 1.15 to 1.25 in the month of June
Crude oil futures posted their worst monthly performance since December 2008 declining more than 15% ended at $74 for May 2010. . Oil prices fell to $65 from $86 in the first half as Euro plunged to near 1.21 against dollar curbing investment from oil to precious metals and dollar. Crude oil futures recovered from lows and managed to trade near $75 in the second half as subsequent moves by EU finance ministers to guarantee liquidity for vulnerable economies restored confidence in the world markets.
The most awaiting hurricane season is at the gate and NOAA- National Weather Service projects ‘active to extremely active’ Atlantic Hurricane Season for 2010. There is a 70% chance that three to seven major hurricanes will swirl in the Atlantic in the six months following the start of the hurricane season on June 1, according to NOAA's Climate Prediction Center. A typical season has 11 named storms, six hurricanes and two major hurricanes. Oil prices are expected to trade higher and may see $87 levels facing very volatile sessions on better economic outlook supported by summer driving demand and speculative trades on Hurricane season with support at $65.
Natural Gas futures rallied more than 10% capping the biggest monthly gain after December 2009 ended at $4.34. Natural gas prices managed upward momentum from the previous month as investors hatched the buying opportunity at $4 on higher demand forecast in summer. Natural gas prices are expected to trade higher on summer cooling demand expectation and supplies and shipment disruption problems in GoM due to BP oil spill backed by intense hurricane season forecast. Growing supplies will limit upside with resistance at $4.70 level, support for falling prices lies at $3.80
Gold-“A mask of Gold hides all deformities.” –The statement proved to be correct in the last month as investor around the world rushed for safe heaven demand against probable expectation that Europe’s debt Crisis may stall the global recovery resulting the bullion to make all time high of US $1250 an ounce. ETF’s around the world bet the most on Gold as many of them made the all time high holdings. SPDR, the biggest Exchange traded Fund backed by bullion has added the skyrocketing 109 Metric Tons on a monthly basis making the all time high of holdings at 1268 Metric Tons. Indian Gold Prices also rallied to record high Rs 18700/ 10 gm, rising 7% during the month of May. This rally was supported by 4% depreciation in India Rupee and 3% price rise in COMEX Gold. The expected Price Range for Gold June Month contract is $1170/oz to $1280/oz.
Silver, basically a precious metal but because of it’s large industrial usage often considered as an industrial metal and hence sometimes guided by the metal prices which is what exactly has happened in the last month. Even after strong China’s CPI as well as positive US industrial data Euro pessimism overshadowed the Silver demand in the expectation of slower global recovery resulting the flat ending with the 0.37% in red trading at $18.56/oz. For the June month, we expect the prices to trade in the range of $17/oz to $21/oz.
Base Metals complex nose-dived in the previous month as the debt concerns overhaul in the market coupled with dollar’s rally and mounting speculation that China’s efforts to cool its economy will erode demand from the largest consuming nation. Base metals prices were dominated by mixed sentiments in the market as positive economic data from US and ongoing European crisis meddled with prices. US economic data showed improvements in housing and consumer confidence but only managed to spark brief strength in the counters. For next month, prices of base metals to remain more or less sideways with negative bias during June. Lead and zinc looks negative on lack of real demand, while copper and nickel could see some buying opportunity at lower levels.
Copper closed at Rs 319 per kg, down near 3% in a month. The decline in LME Copper forwards was more than what we saw in Indian futures. LME three-month forward prices settled at $ 6940 per tonne, down by 7%. Inventories were down in May, declining by 22575 tonnes or 4.5% in LME to 476725 tonnes. One Month expected trading range for LME Copper would be $6000/t-$7400/t.
Lead and Zinc futures declined sharply, as risk-averse investors abandoned the volatile base metals market and headed for safe haven investments such as gold. Lead market fundamentals remain weak, at least over the near term. Stockpiles are rising and there is no sign of decreasing output, or increasing demand. Lead for three month delivery on the LME hit $1721 level and closed at $1850, down 17%. Next Month expected trading range for LME Zinc would be $1700/t-$2200/t and Next Month expected trading range for LME Lead would be $1550/t-$1950/t.
Nickel prices have remained relatively strong during the year however last month was skeptical due to jitters in broader markets. Lower Steel prices and declining confidence of investors have affected the prices of Nickel badly. LME 3-month nickel prices came under pressure on Europe sovereign debt default contagion fears and threats of Chinese monetary tightening. LME nickel prices settled at $21350/t, worst performer on metals counter as down by nearly 19%. Next Month expected trading range for LME Nickel would be $19500/t-$22000/t.
Thursday, May 13, 2010
A GREEK TRAGEDY IN THE EUROZONE
External debt (or foreign debt) is that part of the total debt in a country that is owed to creditors outside the country. The debtors can be the government, corporations or private households. The debt includes money owed to private commercial banks, other governments, or international financial institutions such as the IMF and World Bank. This is similar to how an individual’s debt can include business loans, mortgages, credit card debt or student loans. Debt-to-GDP measures financial leverage of an economy.
World Top Twenty Debtors Nations
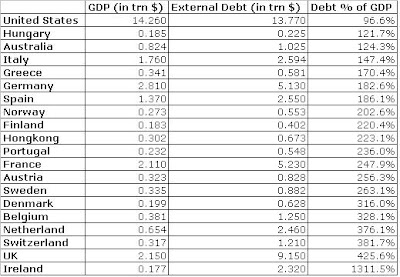 Source: External Debt (2009) information from The World Bank, GDP (2009) information from the CIA World Factbook.
When the European Union (EU) was formed, there was a fiscal deficit limit of 3 percent of GDP, but very few countries have honored that. Greece has a fiscal deficit of 12 percent of its GDP, four times the limit specified in the eurozone agreement. When the Eurozone was formed, its criteria also called for a government’s debt-to-GDP ratio to be below 60 percent—which also hasn’t been honored either.
So what does this mean? According to the World Bank and the IMF, external debt sustainability (the ability of a country to repay foreign debts) should not be more than 250 percent of a country's revenue or 150 percent of exports. Higher external debt is harmful to the economy and most likely will result in default.
So what are the causes of the high debt-to-income ratios in Europe?
Expensive labor.
Expensive exports.
Expensive currency.
Small population.
High levels of taxation and large social welfare systems.
Deficit spending, government debt and private sector borrowing are the norm in most western countries, but due in part to the financial crisis, some nations and economies are in considerably worse debt positions than others.
Most popular rhetoric on the topic would claim that wealthy countries have grown accustomed to being wealthy and they are enthralled by consumerism – it could be argued that this high level of debt could be a result of a culture that is used to and willing to buy now, and pay later…even if it means with interest.
Friday, April 23, 2010
Impact of Yuan Revaluation on Commodities
China % of world consumption & seaborne production 2010E
 Source: JP Morgan
Allowing the yuan to resume appreciation may help China control inflation amid record lending growth and surging property prices. The exchange rate has been kept at about 6.83 per dollar since July 2008 to help Chinese exporters wither the global recession.
Even a rise of 3 percent in the value of the yuan, the range of increase discussed, to around 6.60 to the dollar from last year's average, would have a profound effect on China's $244 billion commodity bill. Last year the country spent around 607 billion yuan ($88.97 billion) on importing oil, 343 billion yuan ($50.28 billion) on iron ore and 206 billion yuan ($30.20 billion) on copper. An increase of 3 percent in the yuan would have saved the nation some 56 billion yuan ($8.21 billion) on its commodity purchases, or enough to buy more than 1 million tonnes of copper.
The last time China raised exchange rates back in 2005, commodities saw a steady rally for more than a year after the revaluation. At that time copper prices doubled to a then record high of $8,800 a tonne in 2006, chipping around half a million tonnes off copper consumption annually.
 Source: Bloomberg
The above chart shows the CRB Index, which tracks 19 commodities, the yuan exchange rate in the spot market and 12-month non-deliverable forwards for the currency. The CRB index surged about 10 percent in the first six weeks after China ended its decade-long peg of about 8.3 per dollar in July 2005, and that could be repeated.

 Ahmedabad Time